Let's Make Littering Data-Centric
Published: May 2026 — by the eCleanup team
The litter problem is enormous. But enormous problems are not unsolvable — they become solvable the moment we start measuring them precisely. Data tells us where waste is concentrated, what kinds dominate, who generates the most, and — critically — whether the actions we take are actually working. Without it, we are guessing. With it, we can set targets, track progress, and hold ourselves accountable year over year.
This is the case for treating littering as a data problem.
The Numbers We Already Have
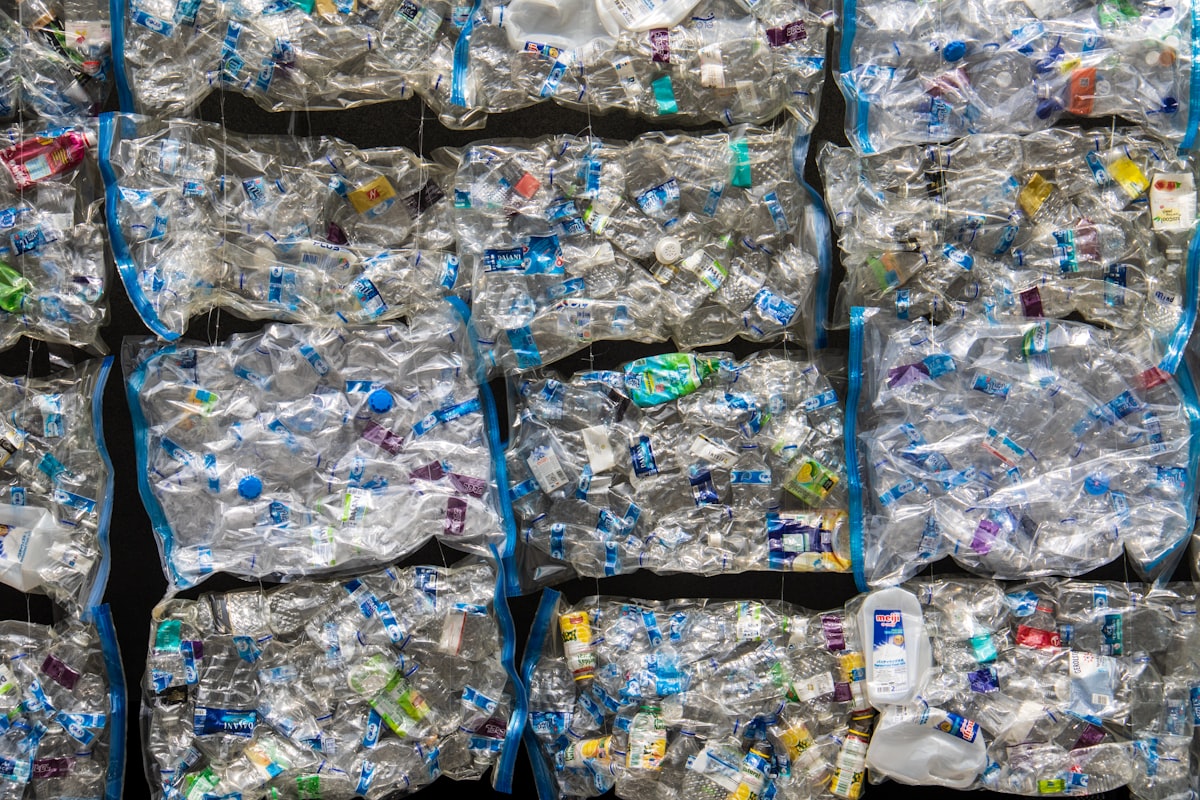
We know a great deal. Global plastics production reached approximately 415 million metric tonnes in 2023, and nearly one in four tonnes is mismanaged — either littered, dumped openly, or left in under-controlled landfills. That is over 82 million tonnes entering the environment annually.
We also know where the concentrations are. Around 70% of all plastic waste entering the environment comes from just 20 countries. The top contributors by volume:
- India — 9.3 million tonnes per year
- Nigeria — 3.5 million tonnes per year
- Indonesia — 3.4 million tonnes per year
- China — 2.8 million tonnes per year
- Pakistan — 2.6 million tonnes per year
But volume alone misleads. Rich countries generate more plastic per person — they simply export or landfill it rather than littering it locally. The mismanaged waste rate tells a more complete story: Nigeria at 87.5%, India at 68.6%, Indonesia at 43.8%, versus the United States at 5.1%. Both perspectives matter. High-income countries need to cut production; lower-income countries need investment in waste infrastructure.
Breaking It Down by Type
Global data collected across more than 100 countries by the Ocean Conservancy's International Coastal Cleanup consistently shows the same pattern. The most frequently collected items over 35+ years of cleanups are:
- Cigarette butts
- Food wrappers and packaging
- Plastic drink bottles and caps
- Plastic bags
- Straws and stirrers
Cigarette butts alone account for an estimated 4.5 trillion discarded worldwide each year, making them the single most littered item on the planet. In roadside litter surveys, they represent around 38% of all items collected. They are also overlooked: people who would not drop a can still flick a cigarette filter without a second thought, partly because filters look small and partly because they are rarely framed as plastic pollution — yet filters are made of cellulose acetate, a synthetic polymer that can take a decade to break down.
Plastic film — bags, wrappers, packaging — is the second largest category. Its light weight makes it travel far from the point of discard, which is why it shows up in rivers, tree branches, and ocean gyres far from any population centre.
What Good Data Enables
Once you know the what and where, you can intervene precisely.
Targeted bans work when they target the right items. Ireland introduced a plastic bag levy in 2002, and bag usage fell by 95%. Australia banned lightweight plastic bags nationally, preventing an estimated 1.5 billion bags from entering the environment. Norway focused on bottle deposit schemes and now recycles 88% of plastic bottles. These are not accidents — they are the result of identifying which items dominate the waste stream and designing a proportionate response.
Infrastructure investment can be directed to where mismanagement is highest rather than spread thinly. When waste collection data shows which districts generate the most uncaptured waste, municipalities can prioritise bin placement, collection frequency, and recycling access accordingly.
Measuring reduction over time is perhaps the most important function of data. 127 countries now regulate plastic bags. Without before-and-after data, we cannot know which of those regulations are working and which are symbolic. Annual reporting turns a policy into an experiment with a measurable result.
The Gap: Ground-Level Data
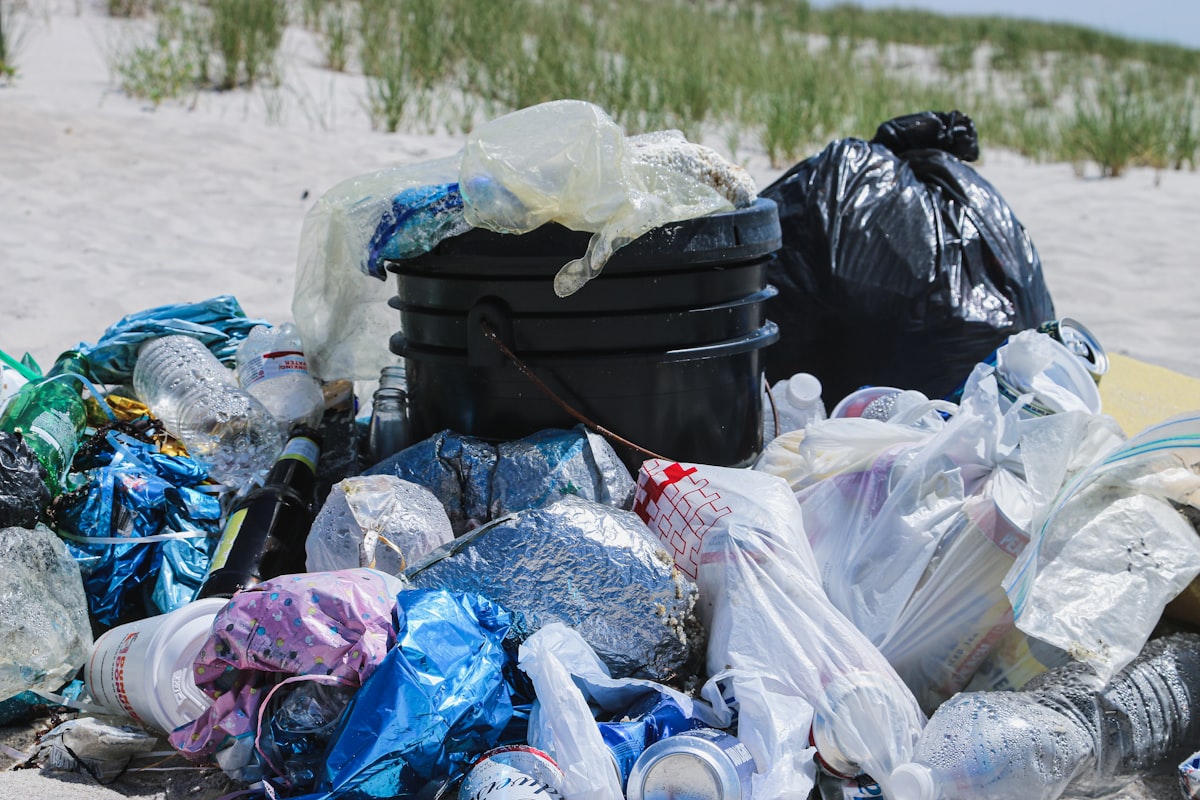
National statistics capture what flows through official waste systems. They are poor at capturing litter that never enters that system at all — the wrapper dropped on a trail, the bags accumulating behind a park bench, the tyres tipped into a river.
This is where community-reported data fills a gap that government surveys cannot. When people document litter hotspots precisely — location, type, volume — that data can:
- Reveal concentration patterns invisible to national surveys
- Help local authorities prioritise clean-up resources
- Track whether a hotspot improves after intervention
- Accumulate into a year-over-year baseline that measures real change on the ground
A single report has limited value. Ten thousand reports, tagged by category and location over several years, is a dataset that can inform policy.
The Goal: Declining Metrics, Year on Year
Data-centricity is not about admiring the numbers. It is about committing to make them smaller.
The framework is straightforward: pick a measurable metric, establish a baseline, set a yearly target, track it publicly, and adjust when targets are missed. Applied to littering, this means:
- Total mismanaged plastic waste (global, by country) — target: decrease 10% per decade
- Most littered item by volume — target: identify, legislate, track reduction
- Litter density per km² in monitored areas — target: reduce hotspot count year on year
- Cigarette butt recovery rate — target: match countries like France where dedicated disposal infrastructure has measurably reduced pavement litter
None of these targets are science fiction. Countries and cities that have committed to specific, measurable reductions and published progress data have consistently outperformed those that set aspirational goals without measurement.
The world generated more plastic in 2023 than in any prior year. But we also have more data, better satellite monitoring, more citizen reporting tools, and a growing body of evidence about which interventions work. The trajectory can change. The question is whether we will measure it closely enough to know when it does — and act fast enough when it does not.
Every report logged on eCleanup is a data point. Over time, those points become a map of progress — or a map of what still needs to change.
Sources
- Our World in Data — Plastic Pollution (data explorer by country)
- Natural History Museum (2024) — Almost 70% of plastic waste produced by just 20 countries
- NOAA Ocean Service — Most common items found as ocean litter
- Ocean Conservancy — International Coastal Cleanup annual data
- World Resources Institute — 127 Countries Regulate Plastic Bags: Are They Seeing Less Pollution?
- World Bank — What a Waste 2.0: Global Solid Waste Data
- UNEP — Beat Plastic Pollution